
Scots literacy rates
Scots literacy rates
In which I justify my claim that the Education and Publishing sectors in Scotland are disproportionately less literate in Scots than the general population.

At the time of the 2011 Scottish Census, the population aged 3 and over was reported as 5,118,223 people. Out of this number, 3,188,779 reported they had no skills in Scots, and 1,929,444 reported some skill in Scots (they could either understand, speak, read or write). That is 37.7% of the population, more than a third, closer to two fifths than to a third.
Whilst some people only understood the spoken language, and some could speak it and not read it, there were a total of 1,225,622 who reported they could read and write in Scots, 23.9% of the entire Scottish population.
Whilst we wouldn’t expect people who could only understand English to be able to read and write Scots, we can say that among those who could understand Scots at all, 63.5% were confidently literate in Scots and could reported that they write it.
Where they wrote their Scots is another issue, as discussed in last weeks article.
There were substantial regional variations, in Glasgow 20.5% of the regional population reported they could read and write Scots, in Aberdeenshire it was 35.8%. Not a majority, but a significant minority - one in five people or one in three.
Whilst looking at whole local authority areas in the census is fun, the smallest data area provided is the Output Area, of which there were over 46,000 areas across Scotland, each representing around 50 households or 100 people.
We can find the Scots skill rate and Scots literacy rates for each of these Output areas and plot them on a graph.
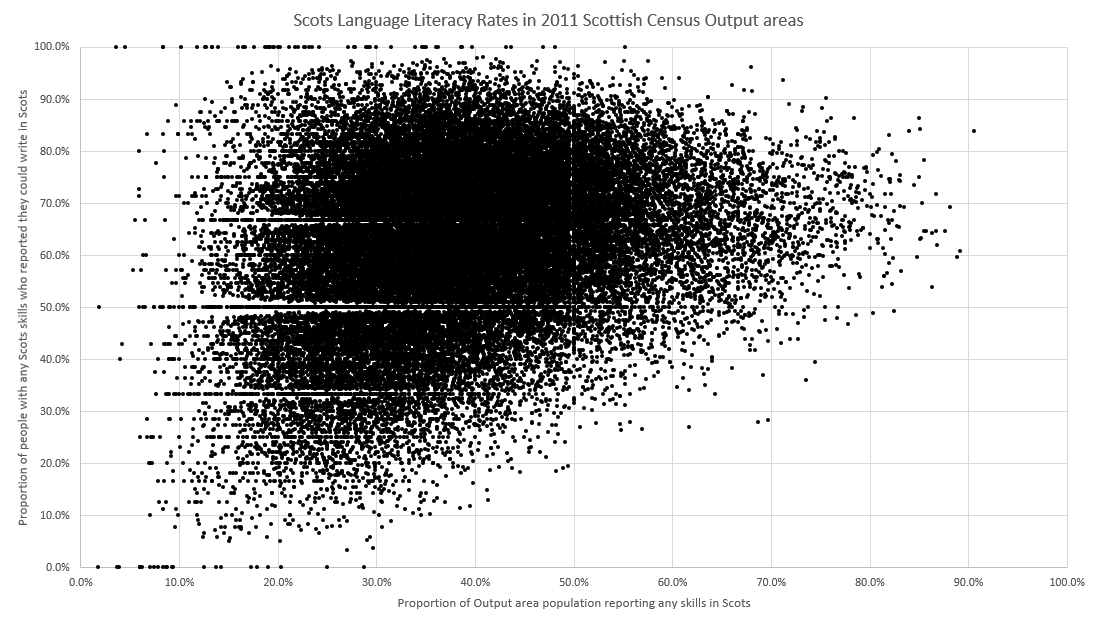
This gives a large amorphous blob, wherein its difficult to see any trends.
It will be helpful to understand this graph by dividing it into four quadrants and characterising each quadrant.

Top left represents areas where there aren’t many Scots speakers, but the few Scots speakers are also very literate in Scots.
The top right quadrant represents areas where “most people speak Scots” and “most people can write it”
The bottom left quadrant represents areas where “hardly anyone speaks Scots” and “no one writes Scots”.
The sparsely population bottom right quadrant represents areas where there is a high proportion of Scots speakers but very few can write it.
In this context, it is obvious why the fourth quadrant is mostly empty, areas with a greater proportion of Scots speakers are not likely to have many people who are illiterate in Scots.
The census categorises people into Social Grades, which are based on their employment level and industrial sector, its a proxy for social economic class. We can characterise each output area by the median social grade. If most people in an area are very highly paid, then its an AB area, if most people are unemployed or low paid then its a DE area. If its a bit of a mix or the residents are averagely paid, then its a C1 or C2 area.
However, if we colour code the datapoints by median Social Grade, and only look at the highest and lowest social grades, AB and DE, we can very clearly see that those who are illiterate in Scots are mostly from the AB social grade.

270,462 people live in AB output areas, 77,346 people in these areas reported any skills in Scots, and 32,038 people reported they could write in Scots.
28.59% any skills
41.42% literacy rate.
544,167 people live in DE output areas, 225,197 people in these areas reported any skills in Scots, and 165,020 people reported they could write in Scots.
41.34% any skills
73.28% literacy rate.
The relative groupings of the AB and DE Output areas suggest its not merely a matter of areas with most Scots speakers have higher literacy rates. DE areas are more literate whether they have a high proportion of speakers or a low proportion. Conversely AB areas are less literate across the board.
The C2 social grade areas, representing low middle-earners are closer to the DE level of Scots skills and Scots literacy. The C1 social grade areas are generally between AB and C2 levels.
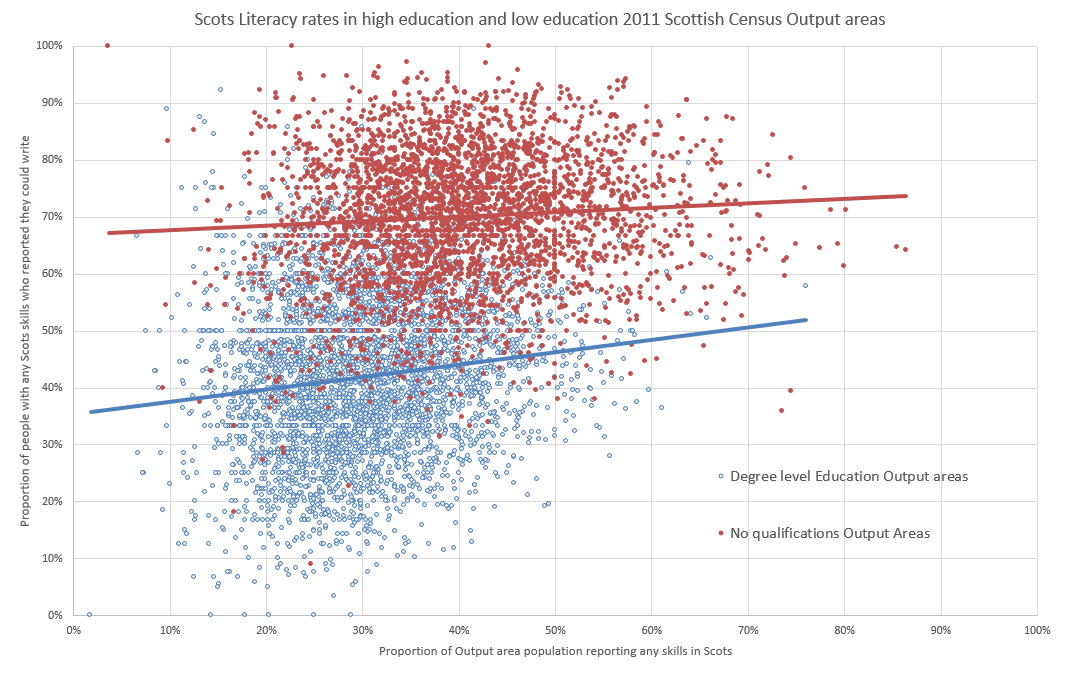
The 2011 census also gives the highest level of education and qualifications for each reportee, we can use this to characterise the education level for each Output area. Plotting a graph of the highest and lowest education level areas yields the same sort of split and groupings as Social Grade, because education level and social grade are very closely correlation, they are effectively measures of the same facet of a person. Highly paid people are generally highly educated, low paid people generally have fewer qualifications.
The census records people’s professions and which industries they are involved in. By characterising Output areas by industry, we can see how Scots language skills are dispersed and which sectors have more literate Scots speakers and which have the less literate.
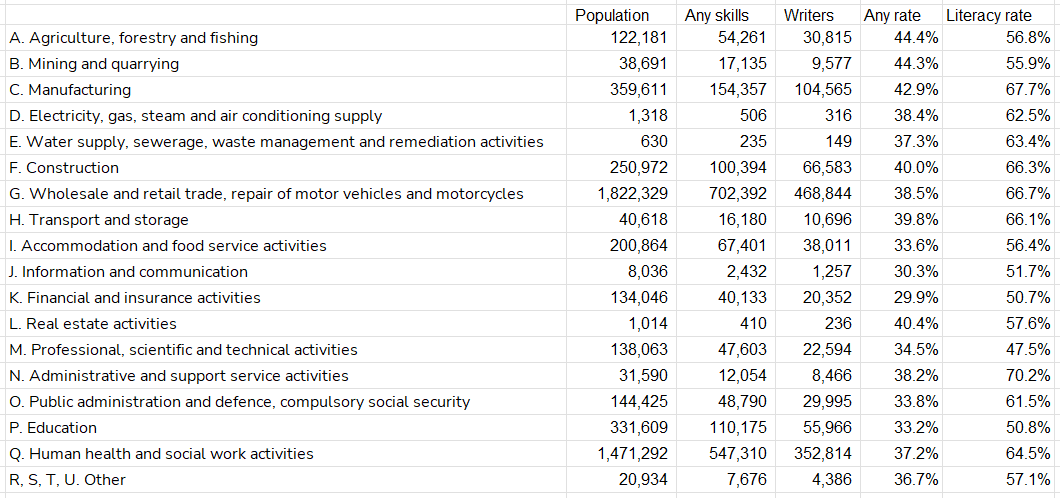
Here we can see that the Administration, Manufacturing, Wholesale and Retail and Construction sectors were most Scots literate with around 40% people with any Scots skills and between 66% and 70% Scots literacy rates, above average compared to the whole population.
By comparison the Professional, Financial, Education and Information sectors were the least Scots literate with around 32% people with any Scots skills and Scots literacy rates between 47% and 52%.
The Education and Information sectors are somewhat troubling, we might expect people who’s entire vocation is to communicate with people to have better communication skills than the population average, across the various languages.
From colour coding all the datapoints for these two sectors and all other sectors we can see the trend lines are about 10% apart across the board. People who live in areas with a high proportion of Information and Education sector workers are 10% less likely to report they are literate in Scots.
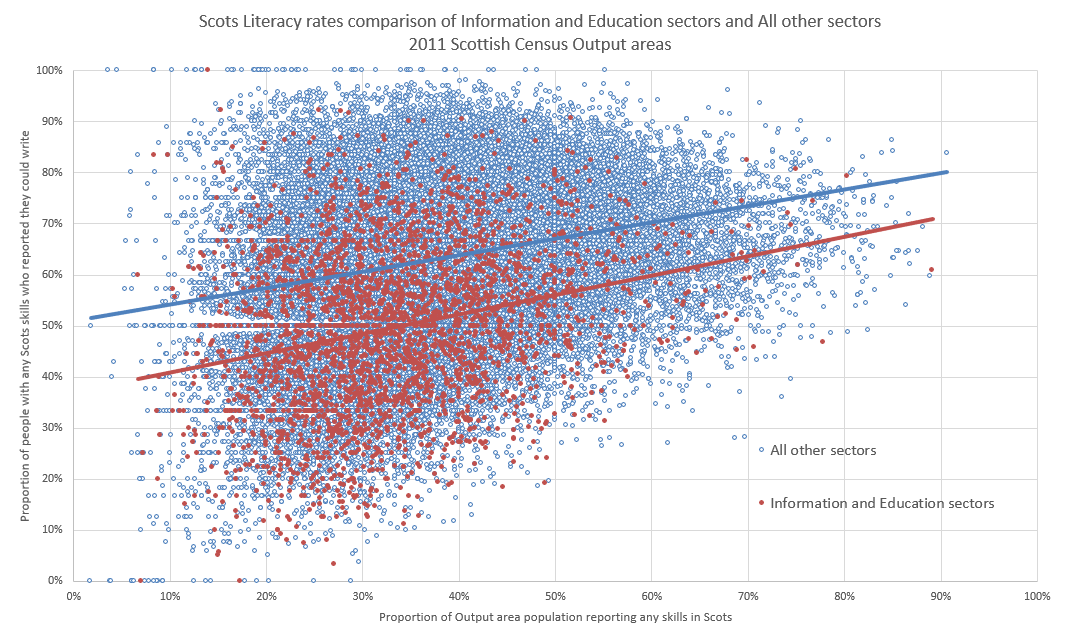
This lack of Scots language ability is entirely due to the concentration of AB social grade people within the Information and Education sectors compared to other sectors, rather than anything exceptional about their skill-sets.
We can see this by comparing only the AB social grade areas of Information and Education, and AB social grades every other sector. The two trend lines are almost identical.

Whilst this explains the issue, it doesn’t excuse it. The majority of people in Scotland with any ability in Scots are literate in the language, except for people in the Information and Education sectors, this includes teachers, broadcasters and publishers, the very people who are needed to cultivate and grow the language.
Their disproportionate lack of literacy is inadvertently oppressing the language.
Perhaps a focused PR and education effort by Scots language activists in needed, focussing specifically on these sectors. This could be more urgent that merely providing educational materials for schoolchildren.
In fact schoolchildren are more literate in Scots than the Information and Education sectors. Scots speakers in the 10 to 19 age bracket typically had a Scot literacy rate of 68.2% - substantially higher than the 51% of the Information and Education sectors.
Whilst there are many literate Scots speakers in broadcasting, publishing and education, the sectors as a whole are illiterate compared to the general population, and leave the Scots speaking population in particular badly served.