My views on the Scottish Census 2022
With fancy graphs and analysis of Scots and Scottish national identity

First, it is necessary to say that my general conclusion is that more people should buy the book I have somehow spent the last four years compiling, A Frequency Dictionary of Contemporary Written Scots. The 2,500 most common words listed in order of their usage, with spelling variants, for only £20 +postage via print on demand here.

Secondly, I’m an Englishman living in Hertfordshire, so its a bit weird that I have any views on the Scottish census at all, but I guess at the moment we’re all part of the United Kingdom, we ought to take an interest in all of our constituent nations and the languages spoken therein, otherwise what’s the point?
Raw numbers about Scots
Absent from the Scottish Census press release, and the first round of press coverage was the actual numbers involved in the Scots language data.

The basic output from the census has the following numbers for the whole of Scotland:-
All people aged 3 and over - 5,294,863
Understands but does not speak, read or write Scots - 722,589
Speaks, read and writes Scots - 1,176,255
Speaks but does not read or write Scots - 174,252
Speaks and reads but does not write Scots - 158,033
Reads but does not speak or write Scots - 193,302
Other combination of skills in Scots - 20,224
No skills in Scots - 2,850,204
By adding together the various columns we can get the following numbers:-
Understanders - 2,444,659
Speakers - 1,508,540
Readers - 1,527,590
Writers - 1,176,255
As proportions of the entire population these can be calculated as follows:-
Understanders - 46.17% (almost half the population!)
Speakers - 28.49% (three out of ten people)
Readers - 28.85% (three out of ten people)
Writers - 22.22% (more than one in five people)
If we look back at the 2011 census we can find the change in the numbers and proportions over the last ten years.
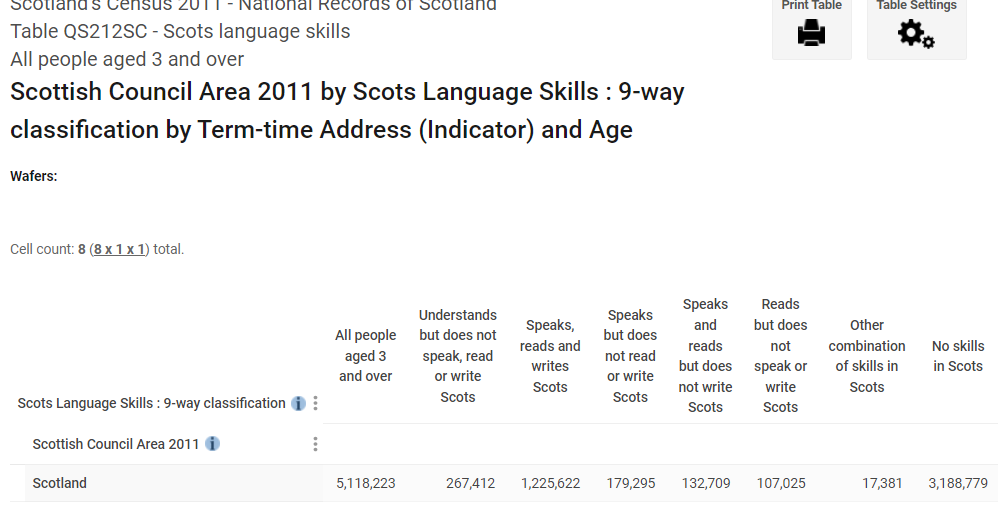
In 2011 there were the following numbers of each type:-
All people aged 3 and over - 5,118,223
Understanders - 1,929,444 (37.70% more than a third of the population)
Speakers - 1,537,626 (30.04% three in ten people)
Readers - 1,465,356 (28.63% three in ten people )
Writers - 1,225,622 (23.95% almost one in four people)
And so the change in each group and the change in proportion of the population are as follows:-
Understanders - increase of 515,215 people or change of +8.47%
Speakers - decrease of 29,086 people or change of -1.61%
Readers - increase of 62,234 people or change of +0.22%
Writers - decrease of 49,367 people or change of -1.73%
If the percentages here seem a little weird, consider that the whole population grew by around 3.45%, if the number of people who spoke Scots stayed the same, then it would be a smaller proportion of the population.
Anyhoo, whilst its great that the number of people with any skills in Scots grew by more than half a million, the number of people who reported they spoke Scots or could write Scots actually fell.
This seems a bit weird to me, so I went onto Twitter to see if anyone else had noticed.
Misinformation
The press release from the Scottish Census only reported the increase in Scots skills, and nothing about the decrease in speakers and writers. A great deal of the news coverage was about the lack of religion (yawn) or the increase in Scottish only national identity.
What was stranger still was the huge numbers of people spreading misinformation about the national identity data.
We must remind ourselves of what the “national identity” question looked like in the 2022 census.

It lists the various nations of the UK, Scottish, English, Northern Irish, Welsh, British and “Other, please write in”, headed with the words “Tick all that apply”. This is effectively identical to the 2011 question, except back the it was “Tick ALL that apply”.
It transpired that 65.5% of people in Scotland reported their national identity was Scottish only, British only was 13.9% and Scottish AND British was 8.2%
According to lots of angry people on Twitter, the question was rigged because it only gave the options of “Scottish” or “other British” and you must select only one.

This is clearly a mistake because 447,000 people managed to tick both Scottish and British. And the angry people on Twitter were getting confused with the “ethnic group” question which was the next one along.

The 2022 ethnic group question was also almost identical to the 2011 ethnic group question. “National identity” and “ethnic group” are two different and separate concepts, and treated as such in the census. There is however a particular political group that likes to combine the two concepts, and they don’t seem to like being called up on it.
There were a lot of people angry about this mis-understanding, and with the census return rate being a little lower than usual, 89% instead of 97%, it was suggested that lots of people who might have selected a particular national identity were missing from the data.
Age cohorts
Let us imagine asking every 40 to 44 year old their views on the matter, and then just over ten years later asking every 50 to 54 year old the views on the same matter. We could in this situation identify how many of them had changed their mind, rather than just new people with different opinions.
If we grab the census data for age groups, from 2011 and 2022 and plot a graph of the age profile, we can see that the line for 2022 (dark blue) looks a bit like the line for 2011 (in light blue) but shifted along ten years.
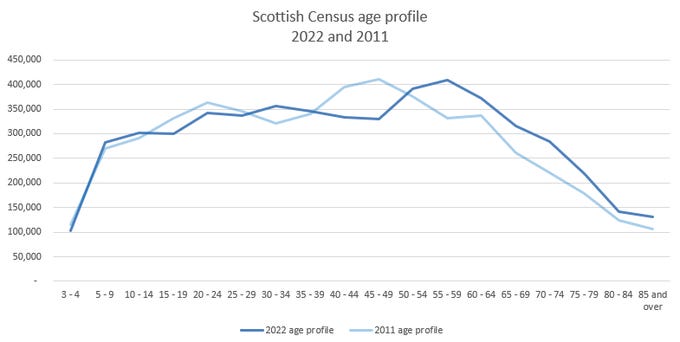
In fact if we offset the 2011 line by ten years, then we can see that the lines match up very closely for the current age range from 25 to 69.

Possibly the younger mismatch are students and transient kids, and the mismatch about the age of 70 are people expiring at an increasing rate. But the big chunk in the middle match up between the censuses.
We can plot a similar graph of the age profiles of people who reported their Scottish only national identity, and it should reveal who changed their minds.
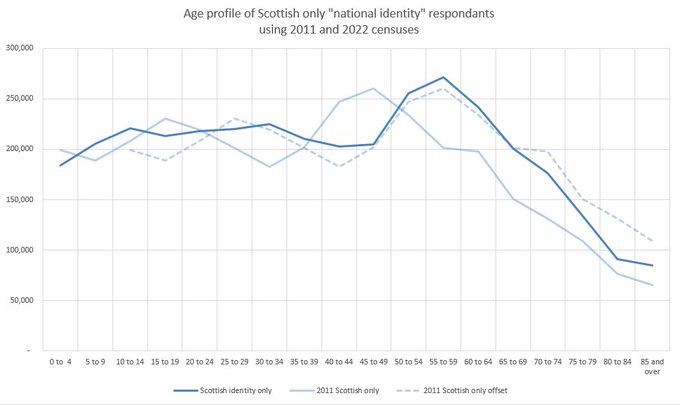
Its a bit hard to see, so I used MS Paint to shade in the changes.

A bit of a mixed bag, young people up to 24 became more Scottish, 25 to 29 became less Scottish, 29 to 64 became more Scottish, 65 and older became less Scottish.
We can plot similar graphs for the “British only” and “Scottish and British” people.


Although at this point I wish to concede that perhaps I should be looking at the percentage of each cohort, instead of just the number of people. So here is the graph of percents of each age group who reported a Scottish only national identity in the 2022 census, and in the 2011 census (offset by ten years).

We can see here that for all age cohorts above the age of 30 the change is consistent, a rise of between 2% and 6%
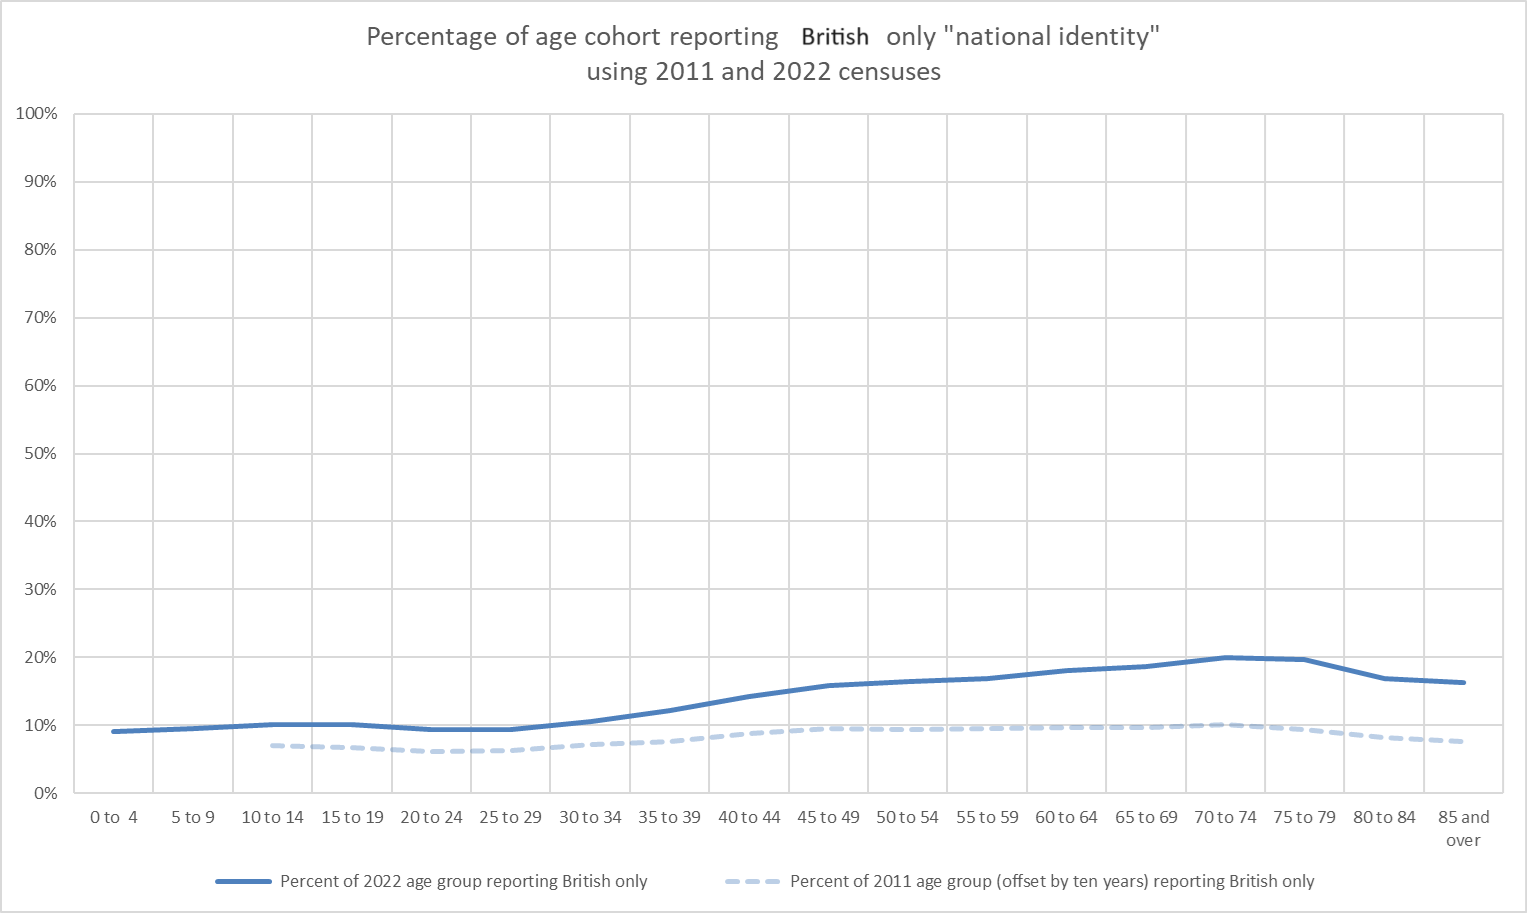
For British only we can see an increase across the whole range of age cohorts, steadily rising from a 3% increase for young people to a 10% increase for the older folk.
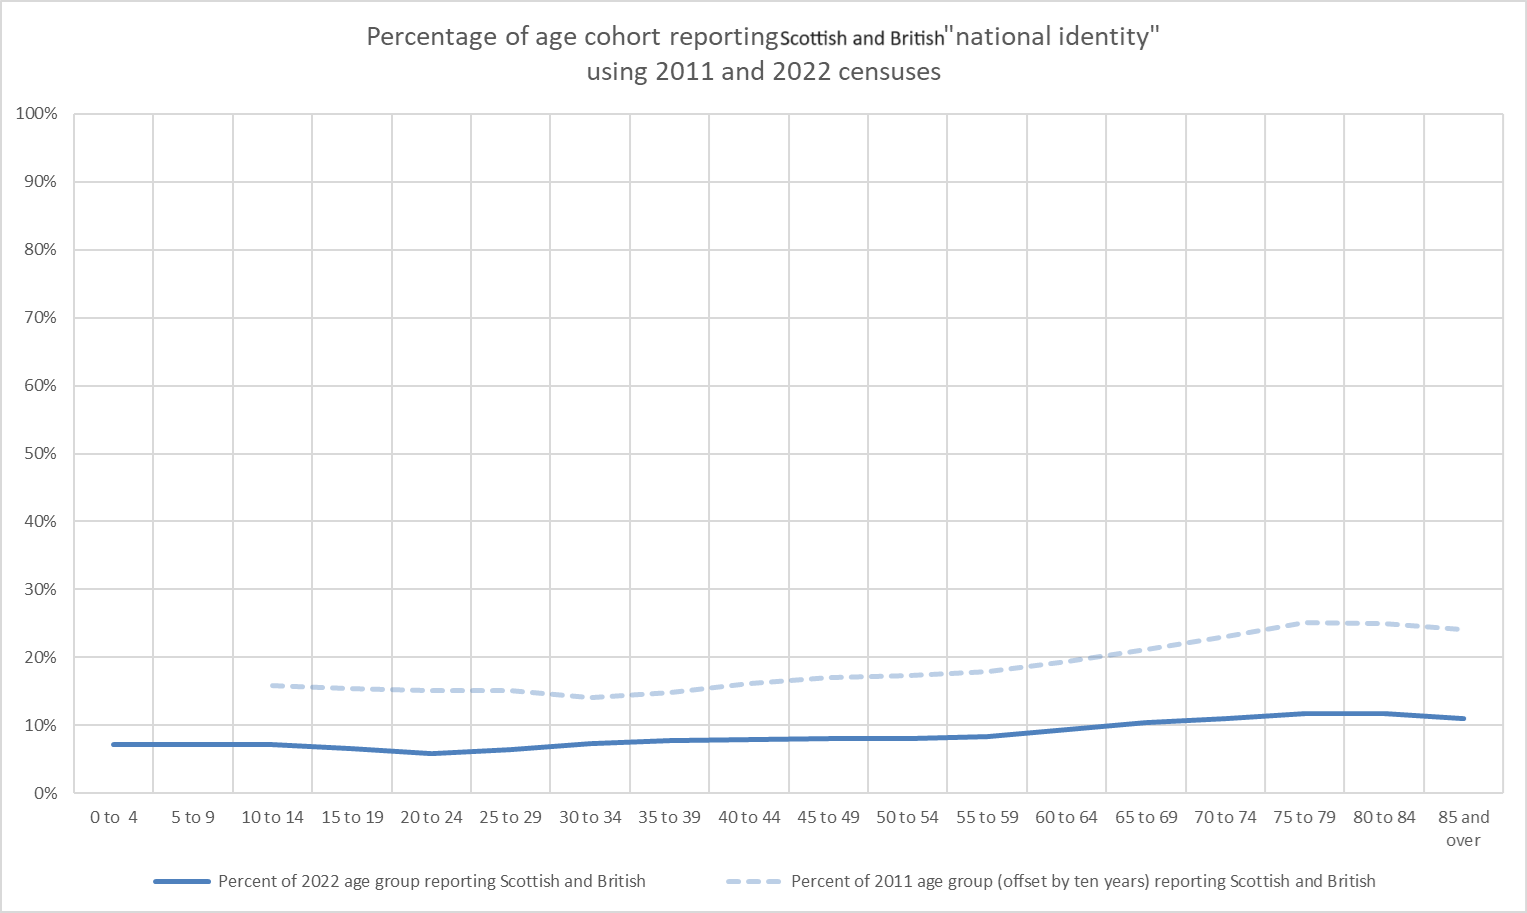
Here we see falls in Scottish and British across all age groups.
It would be useful if we now look at a chart that only displays the change for each of the national identities.

For the past few days I’ve been trying to remember the word for this. The graph shows that people who previously chose Scottish and British have literally changed their mind and picked either Scottish only or British only. The Scottish only mind-changers were consistently between 3% and 5% of the each age group. A greater proportion of old people were likely to opt to British only when they had previously been Scottish and British.
“Polarised” that’s the word, the 2011 Scottish AND British people have polarised their views in 2022 with older people being more likely to go British.
Back to the Scots language
Using the same methodology we can look at the people with Scots language skills.
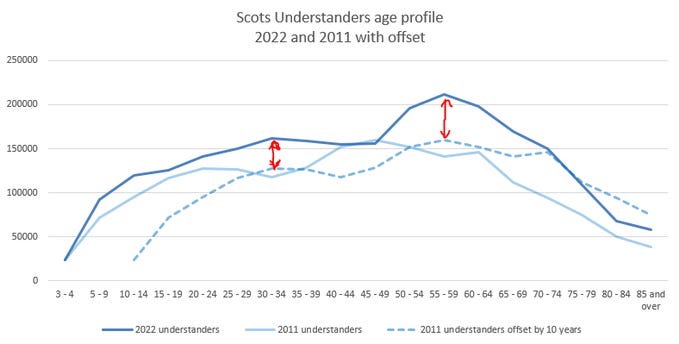
Here we see that the increase in people who reported they could understand Scots is consistent across the age ranges from children up to 74 year olds. This is a net increase, not merely speakers and writers changing their minds.
When we look at people reporting they could speak Scots, we see a different sort of change.
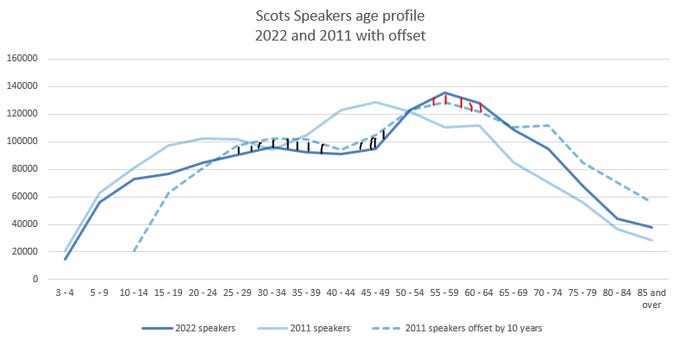
A thin slice of people between the ages of 25 and 50 decided they couldn’t speak Scots and a thinner slice of people between the ages of 55 and 65 decided they could now speak Scots.
When we look at people who reported Scots writing skills we see something a little clearer.

Here there is a big chunk of people between the ages of 24 and 54 who suddenly, over a ten year period, decided they no longer have the skills to write in Scots, and the number who changed their mind was about 49,000 people.
Why would anyone change their mind and decided they were less literate?
A little regionality
In my search for a reason, I started looking at individual regions. First here’s Glasgow

A similar chunk of people in Glasgow now between the ages of 30 and 55 who decided writing Scots wasn’t in their skillset any more.
In Aberdeenshire, its a bit different.

Here its is 20 to 30 year olds and 45 to 65 yer olds who lost the ability to write Scots.
At this point I must confess that I’m not inclined to analyse ever single local authority region in this manner. Instead I zoomed into some of the census “locality” data which I believe is the smallest geographic area that gives the full age profile in 5 year steps.
In Banff the number of people aged 30 to 45 who reported they could write Scots decreased from about 450 to about 230, effectively halved. I chose Banff because I expected the general Scots skills in the area around Banff Academy to increase, perhaps by osmosis or just the general enthusiasm for the Scots language. But seeing the change here was a bit weird.
But I have a theory which might explain the fall in Scots speakers and Scots writers, just a theory.
Over the last ten years, there’s been a bit of a buzz about Scots, lots of popular initiatives to promote it, perhaps not as much as activists would like, but its been taken up by a number of schools.
Perhaps the fall in Scots writing ability for people between the ages of 25 and 50 is because they are of parenting age.
In 2011 they thought they could speak and write Scots, based on personal experience.
But by 2022, they’ve heard their children, and faced Scots literature, and some of them have decided that Scots isn’t what they thought it was. Sure they can understand it, and given some text, they can read it, but their confidence has taken a hit to the extent that they are reluctant to report that they could speak and write Scots.
Is that realistic?
The only way to prove it one way or another would be to compare the census data for language change and households with children. But that demographic data hasn’t been released yet.
After a few days of rumination I have pulled together the numbers of people aged 19 and under in the 2011 and 2022 censuses, schoolchildren. We might expect the percentage of them in aggregate with any skills in Scots to have increased over the last ten years, even if their parents are less confident with their skills.
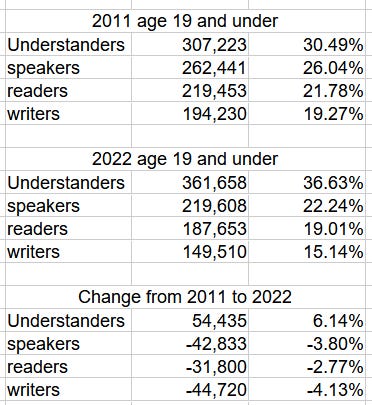
However we can see that the changes in the proportions of understanders, speakers, readers and writers have changed in much the same way as the rest of the population. Understanders have increased by 6.14%, speakers are down 3.8% and writers are down 4.13%.
Does this suggest a failure of both inter-generational transmission of Scots and a failure of schooling?
Despite the efforts of many Scots activist teachers, the children of 2022 are less confident in their speaking, reading and writing of Scots than the children of 2011.
Literacy
In a previous substack article I came up with a measure of Scots literacy which was the number of people in the census who reported the Scots writing skill, divided by the number of people who could understand Scots.
In 2011 63.5% of people who understood Scots could write it.
In 2022 it has fallen to 48.1%.
This is mostly an artifact of the huge increase in the number of understanders. The 15.4% is pretty consistent across all Local Authority regions.
At first, it struck me as weird, we might expect an increase in understanders to include general up-skilling of everyone. Some people who merely understood in 2011 developed the confidence to speak by 2022, people who could merely read in 2011 developed the confidence to write by 2022. This is what happened between 2011 and 2021 with Ulster-Scots in the Northern Ireland census data.
Its also weird that the number of people who can read Scots is now smaller than the number of people who can speak it. It really throws out my theory that there is a hierarchy of skill levels.
Speakers should be a subgroup of understanders
Readers should be a subgroup of speakers
Writers should be a subgroup of readers
I decided to look at some of the other languages of the United Kingdom and their census results over the last twenty years.

Running the calculations suggests that my theory is usually correct, there are smaller numbers of people at each skill level.

The only exceptions being Scots 2022 and Ulster-Scots 2011, in both cases there were more readers than speakers. Its weird, but not exceptional.
Press
The press release from the Scottish Census people didn’t mention the numbers of people with Scots skills or any of the nuance. This has lead to some incorrect reporting.
The Guardian didn’t pick up on the difference between “any skills in Scots” and “speaking” and reported that the number of speakers had increased specifically “spoke Scots to some degree also grew, from 37.7% to 46.2%”, when we know the number of speakers decreased.
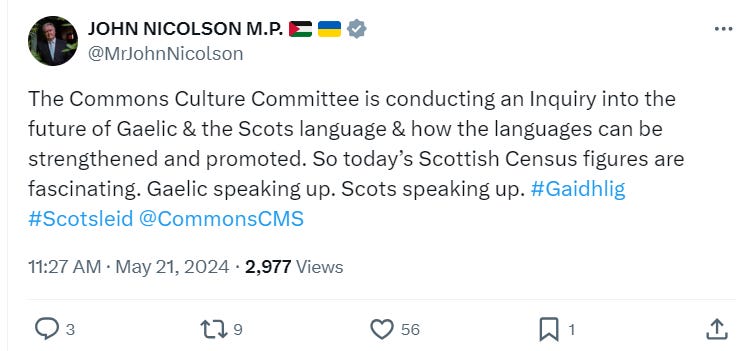
Similarly, MP John Nicolson tweeted “Scots speaking up”, which is not what the data said.
Its a shame that the media don’t care enough about the Scots language to report these things accurately.
Minutes after the Scottish census press release came through, the BBC News website published an article covering religion, national identity, and Gaelic language, with a single line repeating the Scots bit of the press release.
The BBC Alba Gaelic language website had quite a substantial article about the Gaelic language stats, which was followed by an English translated article. And more articles on the subject followed on BBC Alba.
The Gaelic language has been growing in some respects, the total number of Gaelic understanders increased to 130,000 people and the numbers of Gaelic speakers in Glasgow increased by a few thousand. This is great, but its a tiny amount compared to the half a million increase in Scots, which apparently doesn’t deserve as much news coverage from the BBC.
This is because the BBC passively oppress the Scots language by omission, because as a class they are illiterate. This one time a month ago, there was a Westminster Culture Committee hearing on minority languages where some BBC official was to explain Scots language programming and I’m paraphrasing but his response was that “some people are allowed to speak with Scottish accents on River City”. That is effectively the extent of the BBC’s Scots language output.
Whilst two and half million people understand Scots in Scotland, almost half the population, presumably not enough of them work for the BBC for this to be worth mentioning.
What even is the point of BBC Scotland being distinct from the rest of the BBC if they are going to neglect the linguistic ability of half the population?
I pay my licence fee, the folk of Scotland pay theirs too. I want to see the languages of Britain on the British state broadcaster.
Conclusions
Its hard to draw any conclusions at this point.
Over the past few weeks the Westminister Culture, Media and Sport Committee has been taking evidence about how the government can support minority languages, but the announcement of the Westminster general election has buggered that up. Who knows what the committee is going to look like or what their priorities will be in eight week’s time.
Conversely, the Scottish Parliament has their Scottish Languages Bill going through, and as an Englishman in England, I daren’t concern myself with the process.
Instead I can only wait patiently for more Scottish census data to be released so that I can play around with it and see what interesting things are lurking beneath the surface.
That said, did I mention I’m trying to sell this book that I have compiled?
A Frequency Dictionary of Contemporary Written Scots, the 2,500 most common words listed in order of their usage, with spelling variants, for only £20 +postage via print on demand here.
Possession of such a book might conceivably boost the confidence of reluctant Scots speakers and writers, so that in the 2031 census they might tick more boxes.