Scottish Census 2022: On Scots and Education
In which I play around with census data about highest level of qualification and Scots language ability and make some cool graphs. Oh, and the rant at the end is pretty intense.

In the 2022 Scottish census, about 17.3% of people reported they had no educational qualifications and about 32.6% of people reported they could speak, or read, or write Scots.
This article seeks to demonstrate that a disproportionate proportion of the those with no qualifications are Scots speakers, and attempts to explain why.
The census does not provide data for all individuals to the public or researchers like me, but it does break the country into 46,364 “census output areas” each of which has about 100 inhabitants.
Whilst on average 32.6% of the population reported they could speak, read or write Scots, a small and vocal proportion of commentators on social media have suggested “No one speaks it round here”, and that Scots is “only spoken in rural areas, or the north east”.
We can use the Histogram function on Excel to plot the distribution of Scots speakers in output areas, in order to see whether its just a few high proportion areas that are pulling the average in certain directions.

This shows a pretty awesome Normal Distribution. There are some fascinating harmonics around 20%, 25%, 40% and 50% from where proportion of inhabitants of the output areas happens to be a whole fifth, quarter or half, which is quite common if there are approximately 100 inhabitants per area.
The standard deviation is +/-10.96% from the mean, and as with all Normal Distributions, 68.2% of the population are within one standard deviation of the mean, that is between 21.6% Scots speakers and 43.6% Scots speakers. 95% of the population are within two standard deviations of the mean, that is between 10.6% and 54.5% of people in output area are Scots speakers.

We can find the proportion of people in each output area with no qualifications and the proportion who can speak, read or write Scots, and we can plot each Output area as a datapoints on a graph.

The swarm of datapoints around the average isn’t circular, its a bit of a blob. We might be inclined to trust Excel to plot a trend line right across the graph.
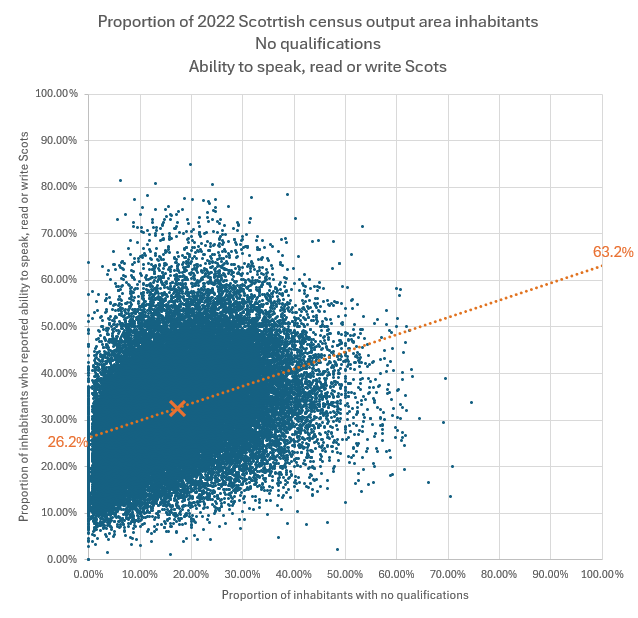
Where the trend line crosses the y-axis on the left at 26.2%, this represents if an Output area had all inhabitants with some kind of qualification then 26.2% of them would report the ability to speak, read or write Scots.
Where the trendline crosses on the right at 63.2%, this represents if we imagine an output area where no inhabitants had any qualifications then 63.2% would report the ability to speak, read or write Scots.
In simple terms on average 63.2% of people with no qualifications speak Scots.
This is a bit of a dodgy extrapolation, but we can test it.
Suppose we split the whole list of 46,364 output areas into two equal sized groups, one with the lowest proportion of unqualified inhabitants and one with the highest proportion of unqualified inhabitants. and then we find the average reading ability of each group.

Doing a trendline on using these two datapoints leads to a similar 100% crossover point, at about 67%.
We can carry out similar extrapolations based grouping all the output areas into either four quartile groups or ten decile groups.

Extrapolate from top half and bottom half = 67.0%
Extrapolate from quartiles = 65.5%
Extrapolate from deciles = 64.3%
Extrapolate from all datapoints = 63.2%
Perhaps rather than a straight linear trendline, a curved logarithmic one fits the data more closely.

I don’t know why it is that a logarithmic trendline is a better fit.
In the next few months the Scottish Census people will release multivariate datasets that might include things like Highest Qualification and Scots language Ability, which will validate or contradict the analysis here.
Alternatively, they might not release such data if they have no interest in the Scots language, because they are highly qualified people, natch.
The census provides similar qualification data for five other classes:-
Lower school qualifications - O Grade, Standard Grade, Access 3 Cluster, Intermediate 1 or 2, GCSE, CSE, Senior Certificate or equivalent GSVQ Foundation or Intermediate, SVQ Level 1 or 2, SCOTVEC Module, City and Guilds Craft or equivalent Other school qualifications not already mentioned (including foreign qualifications)
Upper school qualifications - SCE Higher Grade, Higher, Advanced Higher, CSYS, A Level, AS Level, Advanced Senior Certificate or equivalent GSVQ Advanced, SVQ Level 3, ONC, OND, SCOTVEC National Diploma, City and Guilds Advanced Craft or equivalent
Apprenticeship qualifications - Trade or equivalent Foundation or equivalent Modern or equivalent Graduate or equivalent
Further Education and sub-degree Higher Education qualifications incl. HNC/HNDs - HNC, HND, SVQ Level 4 or equivalent Other post-school but pre-Higher Education qualifications not already mentioned (including foreign qualifications)
Degree level qualifications or above - Degree, Postgraduate Qualifications, Masters, PhD, SVQ Level 5 or equivalent Professional Qualifications (for example, teaching, nursing, accountancy) Other Higher Education qualifications not already mentioned (including foreign qualifications)
We can carry out similar extrapolation exercises for each of these qualification classes, using the logarithmic trendline.

The huge drop-off in Scots speaking between Lower school and Upper school is worrying.
In a general sense, there is no good reason why the proportions of Scots speakers at each education level should vary, they ought to all average around 32.6%.
A narrative that fits this data is that Lower schools acted as a filter, diverting the majority of Scots speakers away from academia.
Whilst schools are no longer allowed to belt children, generations of people were belted in school for speaking Scots. Instead of this being a process that “educated Scots out of people” and taught them to “speak properly”, perhaps this just encouraged the majority of Scots speakers to leave formal education as soon as possible.
For some “as soon as possible” means leaving without any qualification, for many it meant choosing to leave at the end of lower school, and then for some going on to get an apprenticeship or HNC.
Out of those who went on to upper school, they were mostly non-Scots speakers, and and a minority of Scots speakers who learnt not to speak Scots when teachers were around, and then they could graduate and pass on to university.
This would explain why Scots speakers (readers and writers) are in some respects excluded from public life. Very few newspaper editors allow Scots articles, very few television producers allow Scots language to be broadcast, libraries and bookshops freely choose not to stock Scots literature, despite 30% of their target audiences speaking Scots.
It also suggests that among the low qualified there is a huge pool of untapped talent who missed out on satisfactory education because of the filtering effect of schools that were unable to adequately support them.
Among Scots speakers 18% receive a degree or PhD, amongst non-Scots speakers it is 40%. If the education system was changed so that people from Scots speaking households weren’t diverted away from academia and could fulfil their potential at university, we would calculate that an additional 330,000 people in Scotland would have degrees. This would in turn lead to a additional £3billion of income tax.
A second factor that disproves the idea that schools educate the Scots out of people is the fact that the number of Scots speakers has remained constant over the last thirty years at 1.5 million. If schools were successful at unlearning it then we might expect some significant decline in the number of speakers over this period.
Literacy
The data provided by the census is richer and more textured than we have touch upon so far. As the census had tick boxes for understanding, speaking, reading and writing Scots, we can approximate the competence of informants, people who ticked all four boxes are more competent in Scots than people who merely ticked they understand it.
We can come up with an approximated “literacy rate” by dividing the number of people who can write Scots by the total number of people who can speak or read or write it.
The total number of people who can write Scots is 1,176,255 and the total number who can speak, or read or write it is 1,722,066, so the “literacy rate” on average is around 68.3%
Using the same technique as above, we can calculate this literacy rate for each census Output Area, and for each qualification class.

This confirms my narrative about schools filtering out Scots speakers, the most literate in Scots are those who received lower school education and then chose not to proceed any further with formal education. Scots speakers with degrees are half as literate in Scots than their lower school peers.
It has been suggested by some commentators that perhaps its just that Scots speakers are working class, and don’t have the support at home to stay in formal education for upper school and university to get higher qualifications.
I reckon that is nonsense.
Schools and public life are literally set up to reject Scots speakers, not just historically with the belting and punishments, and the daily emphasis on speaking properly every time a Scots speaker opens their mouth, but even today libraries don’t have proportionate selections of books written in Scots, school libraries don’t either, there are no textbooks written in Scots, no maths textbooks, no geography, no history. Council websites aren’t written in Scots, NHS websites aren’t written in Scots, high street bookshops don’t have Scots departments, newspapers don’t regularly or proportionately have Scots language content.
Getting higher qualifications is the main route out of low paid jobs and the less valued socio-economic classes (the other routes being marriage or luck), and if all of society is geared against Scots speakers preventing them from getting qualifications - then claims that Scots speakers don’t work hard enough or don’t have the support at home is not valid.