
Correlation between social grade and Scots writing skills
Correlation between social grade and Scots writing skills
Upper classes are less skilled in the Scots language than working classes

At the symposium for the future of Scots, there was a brief discussion about how scots language skills were generally correlated with social grade, higher social grades were less likely to report Scots language skills in their census returns than the average for each region / city / location.
But additionally it was suggested that perhaps the nature of the skills (understanding, speaking, reading, writing) was correlated inversely, with middle and higher social grade possessing the more sophisticated skills.
Here we will investigate and verify this using census data.
We treat the four skills as essentially cumulative: people who reported they could write in Scots can generally also read, speak and understand Scots. On the other hand, people who reported they could speak Scots also reported the could understand Scots.
Whilst there were some respondents in the census who reported, unexpected combinations of skills, (readers who couldn’t speak Scots, writers who couldn’t understand it), these other combinations made up less than 3% of the total
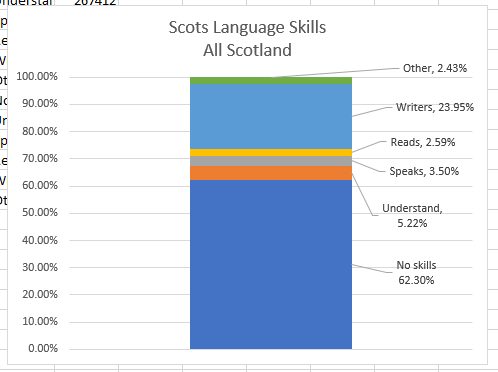
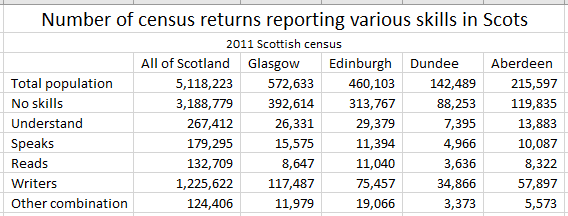
Looking at the population as a whole, the 2011 census reports the following numbers:
Total population (over the age of 3) - 5,118,223
No Scots skills - 3,188,779
Understanders - 267,412
Speakers - 179,295
Readers - 132,709
Writers - 1,225,622
Other combo - 124,406
If we look at four major Scottish cities, we can compare the reported Scots language skills, and see how Scots language skills are more prevalent as we look north and east
As a graph we can see the dark blue area diminish and the light blue area increase.

We might speculate that the relative proportions of each skill remain constant compared to the the people with any skills at all. We can verify this by graphing only those who reported any Scots skills.
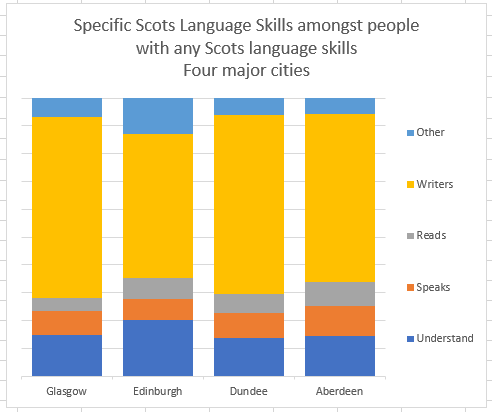
Edinburgh seems a bit different to the others, but Glasgow, Dundee and Aberdeen appear to share the same proportions.
Now if we focus on Glasgow in particular we can compare social grades. By looking at each of the census Output Areas, the smallest statistical division available to us, usually comprising of around 50 individuals or 25 households, and looking at Census table QS611SC - Approximated social grade - Household Reference Persons (HRPs) aged 16 to 64, we can see how many households of each social there are and then characterise each output area as being typically of one social grade.
The Census uses four categories of Social Grade which are derived from the occupation reported on the census
AB - Higher and intermediate managerial/administrative/professional
C1 - Supervisory, clerical, junior managerial/administrative/professional
C2 - Skilled manual workers
DE - Semi-skilled and unskilled manual workers; on state benefit, unemployed, lowest grade workers
As an example, if we look at 2011 OutputArea SO0112189, there are 63 household reference people in total, if we asked them to line up in order of Social Grade and then counted along to the person who was in the middle of our line up, the 32nd person, we would find that they were of the AB social grade. We could characterise this output area as AB, posh, upper class.

There are more than 46,000 OutputAreas in Scotland, with an area of 120 people in each, for the purposes of this investigation we will merely sample ten output areas each in a selection of neighbourhoods.
Park terrace
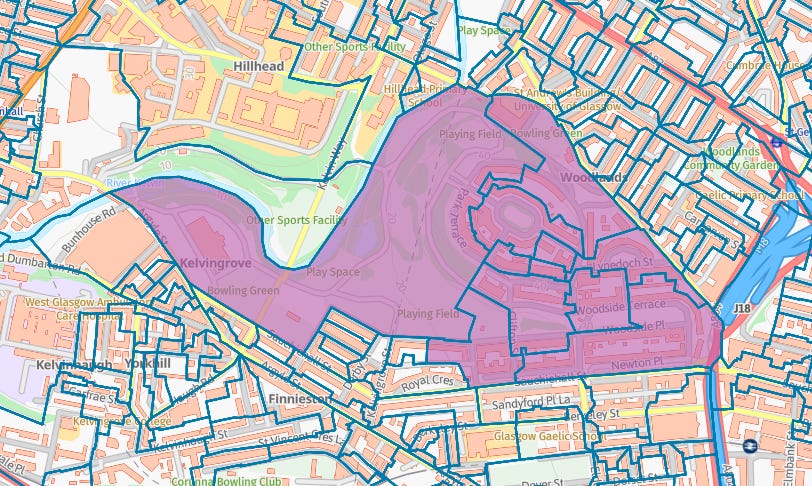
Park Terrace in Glasgow’s leafy-west end, with its expansive views of the the city and parklands, home to lawyers, doctors and DJs.
For this area with a population of 1060 people over the age of 3, 77.2% reported no skills in Scots, so greater than the Glasgow average (68.6%), 6.32% of people merely understood Scots, whilst 9.15% of people reported they could write Scots.
Amongst those who reported any skills it was 27.7% merely understood Scots (above the Glasgow average of 14.6%) and 40.1% could write Scots (below the Glasgow average of 65.3%.
Govanhill
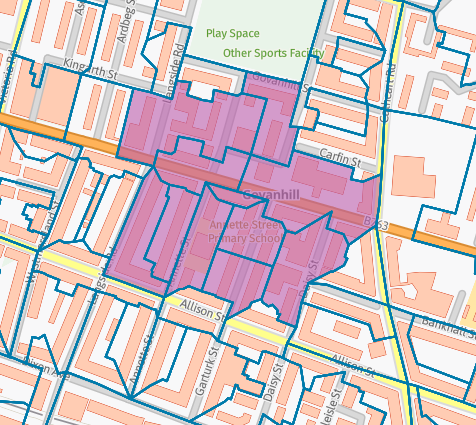
The area sampled contained a mix of C1, C2 and DE OutputAreas, so a mix of middle class, working class and unemployed
For this area with a population of 1,204 people over the age of 3, 76.0% reported no skills in Scots, closer to the Glasgow average (68.6%), 4.9% of people merely understood Scots, whilst 12.6% of people reported they could write Scots.
Amongst those who reported any skills it was 20.4% merely understood Scots (above the Glasgow average of 14.6%) and 52.6% could write Scots (below the Glasgow average of 65.3%.
Haghill
I looked up on Google where the most deprived area of Glasgow was and it suggested Haghill.

For these OutputAreas with a population of 968 people over the age of 3, 61.9% reported no skills in Scots, below to the Glasgow average (68.6%), 5.5% of people merely understood Scots, whilst 24.5% of people reported they could write Scots.
Amongst those who reported any skills it was 14.4% merely understood Scots (meeting the Glasgow average of 14.6%) and 64.2% could write Scots (matching the Glasgow average of 65.3%.)
Scatter
I put all the data together for these three neighbourhood into a nice spreadsheet with columns for the median Social Grade, proportion reporting any Scots skills and the proportion of people with any Scots skills reporting they were mere understanders or sophisticated writers.
And then churned out of a colourful scatter graph.

Its nice to look at, but hard to discern what its telling us. We might note that Haghill (in green) has a greater proportion with any Scots skills than Park Terrace (in orange and yellow), and we might note that Park Terrace has a lower proportion of writers than Haghill.
When we lump each neighbourhood together, and do stacked columns, we can more clearly see that the proportion of writers is greater in Haghill than Park Terrace.
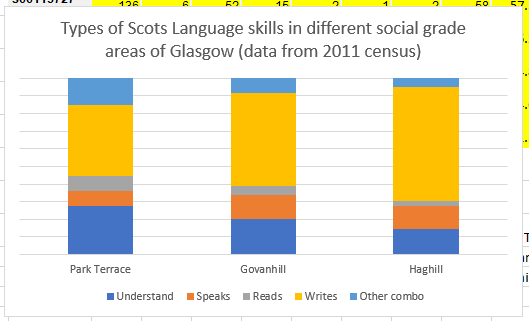
This disproves the original assertion that Scots language skills (understanding, speaking, reading, writing) was correlated inversely, with middle and higher social grade possessing the more sophisticated skills.
If we step away from any biases we have about particular neighbourhoods and just look at the median Social Grades, we can generate some neat box and whisker graphs that show the same thing and give a feel for the spread of skills in each Social Grade.

A larger sample
At this point I worry that perhaps I have cherry picked or just been lucky with the Glasgow neighbourhoods that I picked.
Perhaps the AB Social Grade people merely have the misfortune to not belong to an area that has a high number of people with any Scots ability. Perhaps all the Social Grade lie on a single continuum of Scots language skills.
We can control for this by looking at AB areas in the North East of Scotland where there is generally more Scots usage and comparing them to DE areas in the South West where there is generally less Scots usage.
So I have cast my net further afield and acquired the data for Hyndland in Glasgow (another AB area), Balgay Hill, Hilltown and Broughty Ferry in Dundee (all predominately C1 and C2), and in Aberdeen Seafield (AB), Sunnybank (C1), Sheddocksley (C2) and Middlefield (DE).
Now we have 160 datapoints to plot, from a broader geographical area.
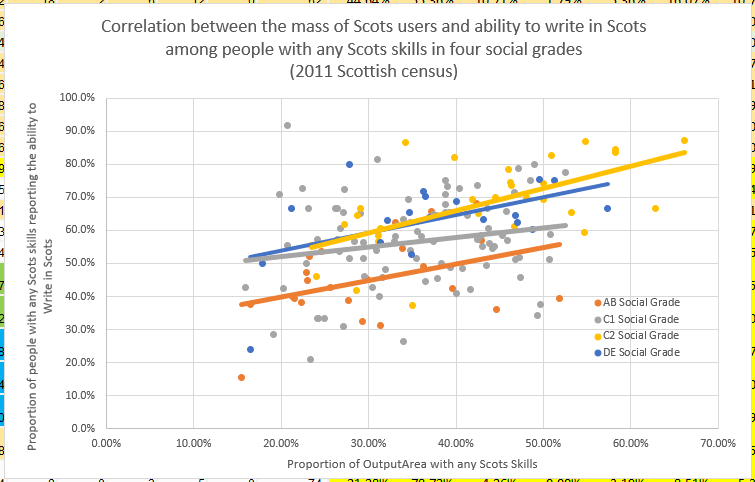
Trendlines for each social grade have been added. From this we can see that there isn’t a single continuum of Scots language ability there are about two continuua. The AB social grade generally has less writing ability than the C1, C2 and DE social grades, independently of any geographical inclination.
Also we can clearly see that C2 and DE social grade Scots users are more likely to be able to read and write in Scots.
Decision makers
It was only after I’d done all this research, that I was bickering on Twitter and it occurred to me that the census also contains detailed information about employment. In fact the Social Grade that I had been using as a proxy for Social Class, was derived from people’s reported jobs. And we could actually look to see if people in specific industries, such as broadcasting, have less Scots language ability than the general Scottish population.
We can speculate that it is entirely due to the “decision maker” class in institutions simply not having the language ability, and therefore no interest in Scots language output.
Do they realise that they are disproportionately unskilled? Or do they think that they are quite representative of the rest of the population?
Management may say that “no one really speaks or reads Scots”, is it because they can’t, and they assume that everyone is like them?
And if they have a list of permitted Scots words that may be used on air, is that because its merely the extent of their own knowledge of Scots?
Update 17-Feb-2023 - More Data and a change in theory
Since I first posted this substack article I have added more OutputAreas, and more data to the scatter graph, this has lead to something of a revision of my conclusions.
Now with more than 400 datapoints on chart, covering Glasgow, Edinburgh, Kirkcaldy, Dundee, Aberdeen, Peterhead, Orkney, and Shetland, we can look at the whole mass and see a flawed correlation between the proportion of people with “any skills in Scots” and the “Scots speakers who can write”
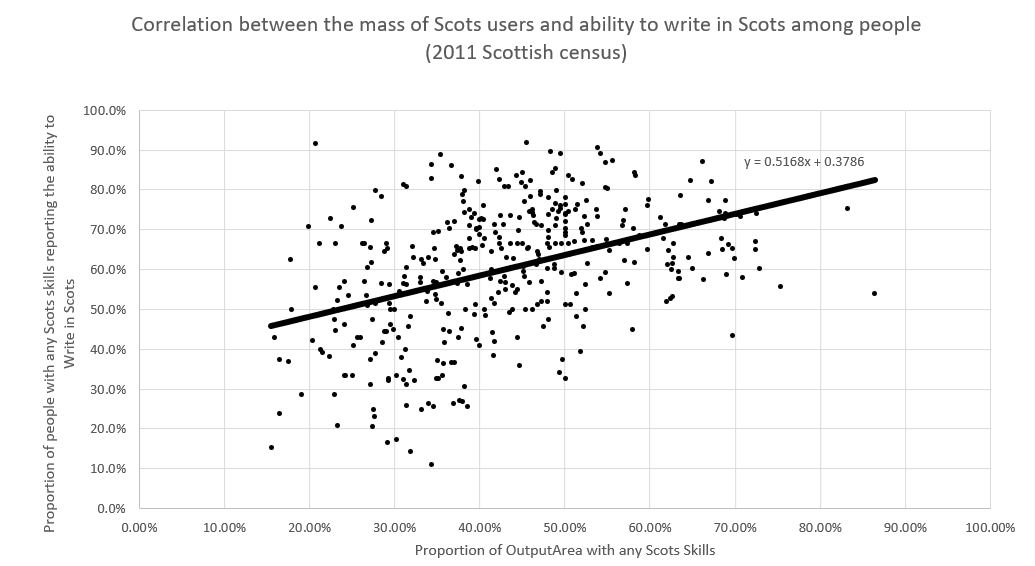
The slope of the best fit trendline is 0.5168. For every 10% increase in the proportion of people with any Scots skills, there is 5.2% increase in the proportion of them who are literate and can write in Scots.
We might conceptualise the chart into four quadrants:-
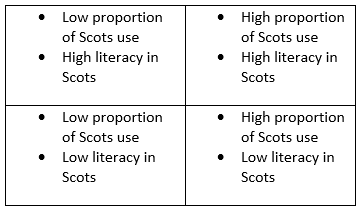
And the trendline goes from bottom left to top right. Based on the earlier graph with less data, we would incorrectly guess that each social grade group has a different trendline but they all go in generally the same direction.
This is wrong!
By plotting each social grade separately it reveals that each group plots trendlines of roughly horizontal strata.
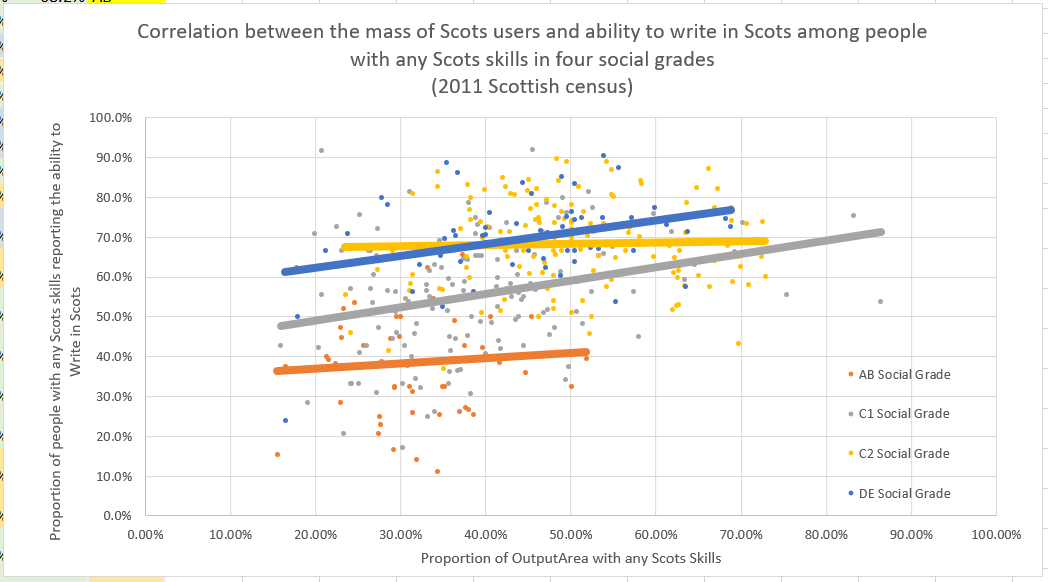
The AB social grade averages out at between 35% and 42% Scots literacy, no matter what proportion of the OutputArea report any Scots skills. The C2 social grade reports averages between 68% and 70% Scots literacy independently of the proportion of Scots users.
In general terms AB social grade is illiterate in Scots, averaging 40%, and the C2 and DE grade are almost twice as literate, averaging 68%.
This doesn’t change the conclusion that the “Decision maker” class don’t have the language ability to responsibly make decisions regarding the Scots language, but re-affirms that is more likely due to Social Grade than due to geography.
Or if you gathered ten managers and directors who said they can speak Scots, then less than half, only four of them could write it. But if you gathered ten admin staff or workers who said they could speak Scots then more than two thirds, seven of them could write Scots.
If a hypothetical broadcasting corporation put together a focus group to decide on Scots language output, a focus group comprised of managers and directors would come to very different conclusions than the admin / workers focus group.
Even if a perfectly composed focus group put together a presentation for the Scots speaking managers and directors, they would still be facing people who were comparatively illiterate and unskilled in Scots and think that everyone else is too.